
Est. 1993 · One developer · Too many interests
Software, games, data tools and 3D models from Kameron Brooks.
Games, tools and experiments from one person. Five released, four in progress.
9 projects · 10 posts · 11 Hugging Face models · last build 2026-10-07

Datalys2
A light-weight configuration-driven framework for creating dynamic dashboards and interactive reports. Build data visualizations with minimal code and export them as standalone HTML files that can be hosted anywhere.
// nanoscript
function fib(n: int): int {
    if (n < 2) { return n; }
    return fib(n - 1) + fib(n - 2);
}
console.log(`fib(25) = ${fib(25)}`);
→ fib(25) = 75025 (13 ms)
Try nanoscript in your browser
Write and run nanoscript right on this site. A full editor with a console, live error checking, and example programs to open, edit, and run. No install required.
- Syntax highlighting and errors as you type
- Example programs included
- Runs on a JS or WebAssembly backend

Datalys2
ReleasedDashboards and reports that compile to one portable HTML file.

Nanoscript
In ProgressA typed scripting language for the browser and Node.
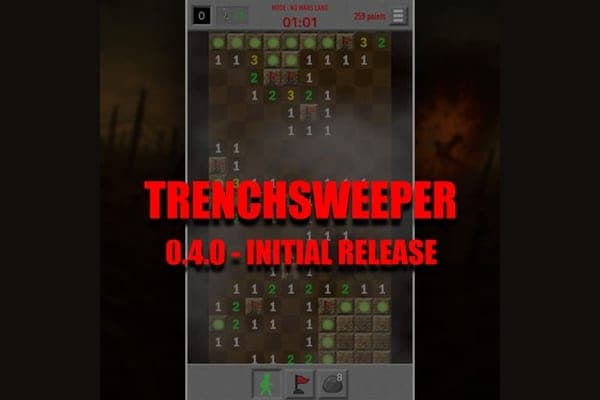
Trenchsweeper
ReleasedAd-free WWII Minesweeper for Android, with live leaderboards.

WITVT
In ProgressSpot-value calculator for precious metals, jewelry and coins.
Y2K CSS
ReleasedThe dither-and-bevel CSS library this site is built with.
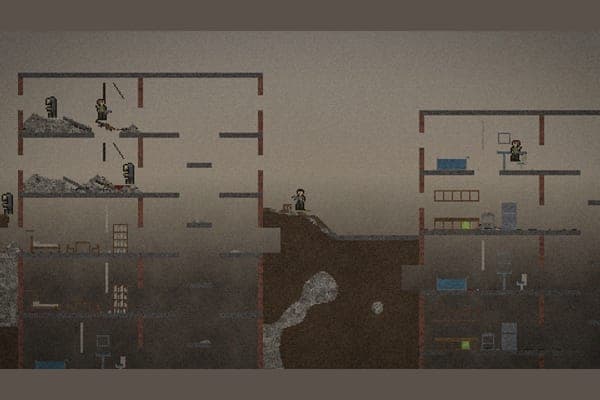
Fallen Sand
In ProgressA post-apocalyptic falling-sand shooter where every pixel is simulated.

Infinitus
In ProgressA chess-like strategy game whose pieces level up and keep a history.

Sweetroll
ReleasedBlender addon that straightens curved UV islands.
- Web DevelopmentY2K CSS: Making a Library Follow a Theme Toggle It Doesn't Know About3 min
- Web DevelopmentNanoscript: I Built a Fake 90s Computer to Run It in the Browser4 min
- Game DevelopmentInfinitus: The Rules Engine Has No Scene3 min
- Game DevelopmentFallen Sand: A World Where Every Pixel Is Simulated4 min
Hard-surface 3D models for games and renders
Cold War era weapons and props, modeled in Blender and sold on four marketplaces.